
Server monitoring tools assure the infrastructure of IT, that is, whether they are performing, available, and secure. Problems are identified and resolved before they affect business operations, all as a result of the influence of developers, IT administrators, DevOps teams, and system engineers who manage and maintain on-prem, cloud, or hybrid environments. Server monitoring tools reduce downtime and optimize system efficiency by constantly tracking metrics such as CPU usage, memory consumption, disk space usage, network traffic, and application performance.
These server monitoring tools are a selection of the top 14, according to key criteria including comprehensive monitoring capability, real-time alerts, scalability, ease of use, automation, support for integration, and cost-effectiveness. The selection is well-fitted to fit any size business, whether a start-up or an enterprise company of any scale to ensure IT teams maintain high availability, prevent failure, and add security. Whether one is a developer, IT manager, or DevOps engineer, the right tool would make a huge difference in improving system reliability and performance.
What is server monitoring?
Server monitoring consists of continuous performance evaluation and analysis of server health alongside availability to figure out smooth server functioning. The monitoring procedure incorporates continuous checks on server metrics such as CPU utilization and memory use as well as disk space availability and network traffic and application performance metrics to identify issues that could affect operational business activities.
Criteria to Select a Server Monitoring Tool
Choosing the right server monitoring tool is one of the primary needs to be met in ensuring that a system remains stable, performs well, and is secure. Among some of the criteria are:
1. In-depth Monitoring: A good tool will monitor key server parameters like CPU usage, memory utilization, disk space utilization, network traffic, and application performance.
2. Real-Time Alerts & Notifications: It should throw instant alerts either via email or SMS or by integrations with applications such as Slack, and Microsoft Teams for identification and quick solving of problems.
3. Scalability: Ability to monitor different servers spread out in on-premises or cloud or in hybrid environments
4. Easy to Use – The user-friendly interface and use of customizable dashboards make it easy to track performances.
5. Automation & Reporting: Automated issue detection, predictive analytics, and detailed reports for informed decisions.
6. Integration Support: Compatible with third-party tools like ServiceNow, AWS, or Kubernetes, to carry on wholesome IT functions.
7. Cost & Licensing: Choose the pricing model according to the business needs: free, subscription-based, or enterprise-level.
That implies optimized server performance and reliability by choosing the tool that best fits your IT infrastructure and business objectives.
List of 14 Best Server Monitoring Tools
1. Dotcom-Monitor
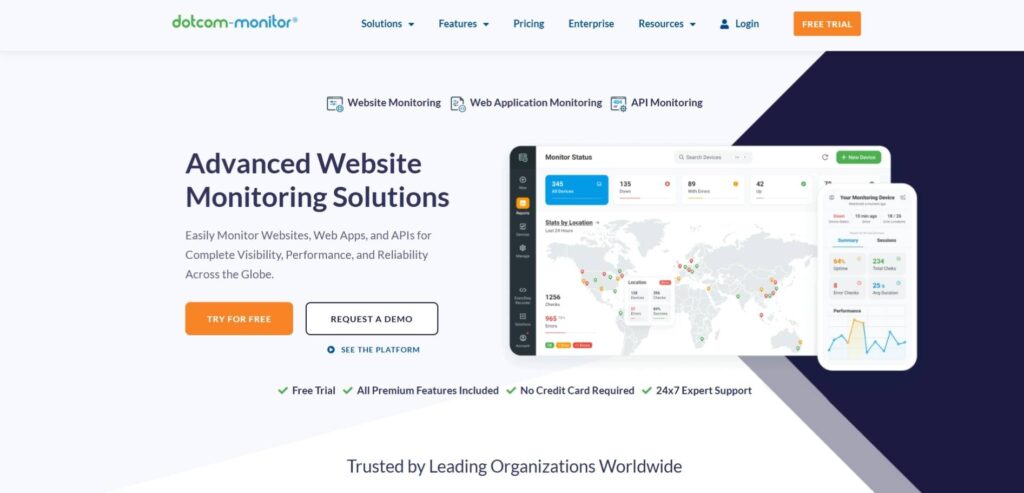
Through its extensive solutions suite Dotcom-Monitor enables companies to maintain website performance and applications and services availability. By operating through various monitoring sites worldwide the platform delivers live performance data about site availability together with page speed measurements and transaction secureness checks.
The system sends immediate alerts with evaluated root cause data that enables fast problem fixes. Users can access continuous communication through various channels on this platform by integrating their monitoring system with email platforms, SMS technology and mainstream collaboration tools to guarantee responsiveness during disruptions.
Key Features:
- Global monitoring from over 30 locations
- Real-time alerts with root cause analysis
- Synthetic user monitoring
- Protocol monitoring (HTTP, HTTPS, DNS, etc.)
- Integration with various notification channels
Pros:
- Extensive global monitoring coverage
- Detailed failure analysis for quick troubleshooting
Cons:
- Advanced features may require a learning curve
- May be more feature-rich than necessary for small businesses
Who Should Use It? Businesses seeking detailed website performance insights and global monitoring capabilities.
2. Site24x7
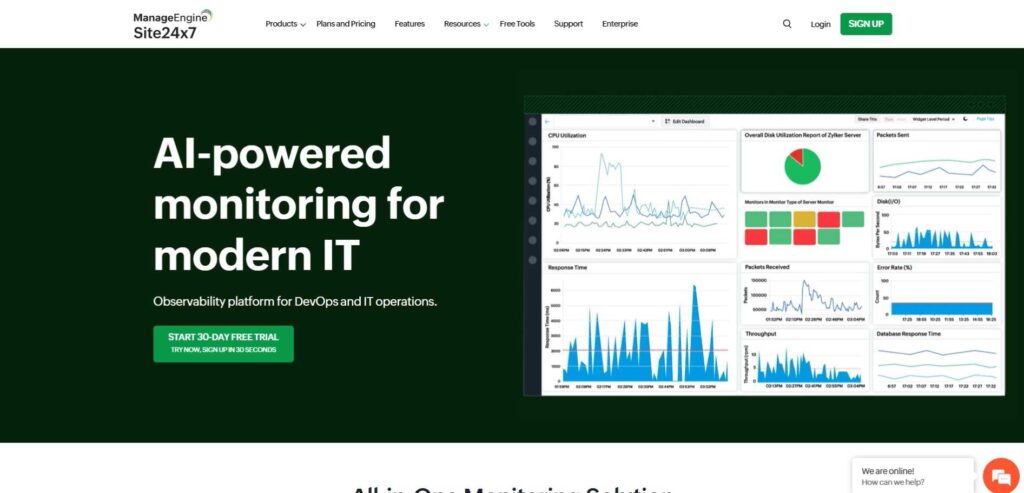
Site24x7 serves as an inclusive solution that gives a real-time understanding of websites together with servers alongside applications and network devices. The solution delivers complete system health visibility because it includes real user monitoring and synthetic transactions together with application performance monitoring capabilities.
Site24x7 enables users to create flexible dashboards and detect anomalies to help them resolve potential issues before they happen. The product features a straightforward interface alongside adjustable alerting protocols that serve companies that need to keep their IT systems at peak performance levels.
Key Features:
- Unified console for infrastructure monitoring
- Custom monitoring via plugins and extensions
- Anomaly detection for proactive issue resolution
- Superior reporting with customizable time frames
- Real user monitoring and synthetic monitoring
Pros:
- Comprehensive IT infrastructure monitoring
- User-friendly interface with customizable dashboards
Cons:
- Some advanced features may require additional configuration
- Pricing can be on the higher side for smaller organizations
Who Should Use It? Organizations looking for a unified monitoring solution with extensive customization and reporting capabilities.
3. NinjaOne
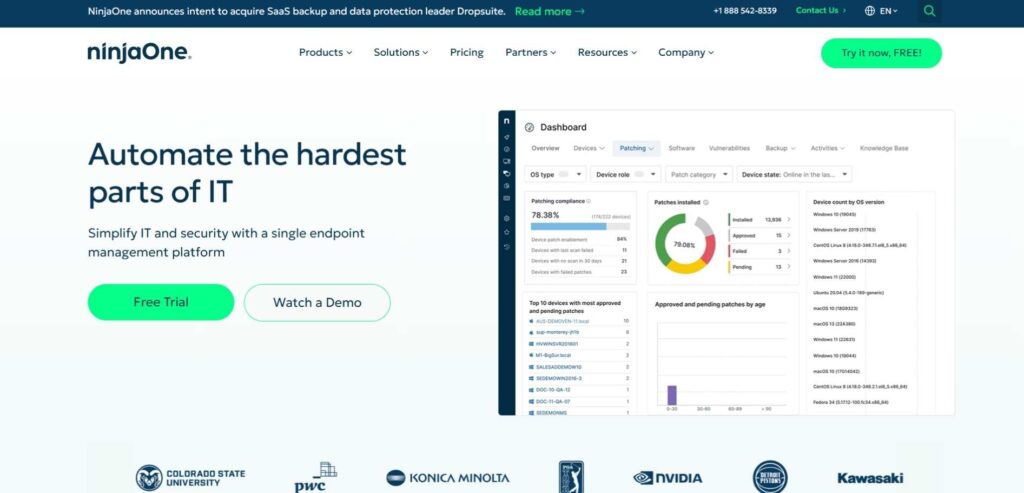
The IT operations platform NinjaOne combines into one platform endpoint management and monitoring with support functions. NinjaOne serves managed service providers along with IT professionals through its real-time monitoring capabilities and its tools for patch management and remote control along with automatized remediation systems.
NinjaOne features an easy-to-use interface that enables users to efficiently handle IT assets resulting in secure maintained systems. The platform includes detailed reporting functions together with alert systems which help administrators resolve problems in advance to provide better services and decrease system outages.
Key Features:
- Unified endpoint management with a centralized dashboard
- Proactive management with live device data and incident context
- Network-agnostic monitoring for continuous visibility
- Configurable and context-rich alerts
- Stellar service and support with quick response times
Pros:
- Centralized platform for efficient IT operations
- Proactive issue detection and resolution
Cons:
- May require time to fully explore all features
- Some functionalities might be more suited for larger organizations
Who Should Use It? IT professionals seeking a comprehensive endpoint management solution with proactive monitoring and excellent support.
4. Datadog
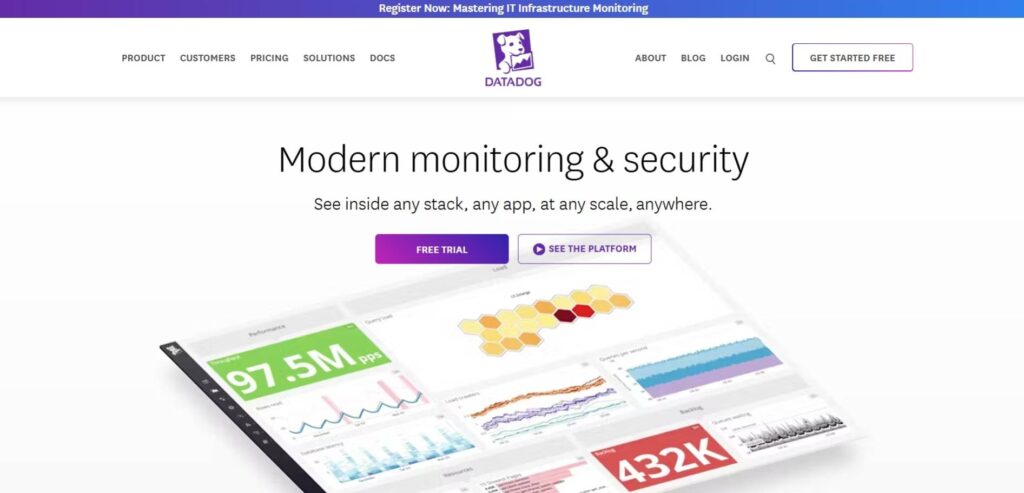
Datadog operates from the cloud through its monitoring and analytics platform which reveals complete oversight across applications and infrastructure and logs. Users can implement Datadog with multiple services and technologies through which they gain immediate dashboards alongside customizable warnings and sophisticated analytical tools.
The distributed tracing together with APM capabilities in Datadog establishes a platform for teams to track application performance and locate I/O hurdles that lead to superior user interaction. Through its scalable framework, Datadog serves businesses of different scales that need complete observability capabilities throughout their technological infrastructure.
Key Features:
- Real-time monitoring of servers, databases, tools, and services
- Advanced analytics and customizable dashboards
- Integration with over 400 technologies
- Machine learning-based alerts and anomaly detection
- Log management and application performance monitoring
Pros:
- Comprehensive monitoring across various platforms
- Strong integration capabilities with numerous technologies
Cons:
- Can be complex to set up and configure
- Pricing may become high as infrastructure scales
Who Should Use It? Large enterprises and organizations with complex infrastructures seeking in-depth monitoring and analytics.
5. Anturis
Small to medium-sized businesses can use Anturis as a cloud-based monitoring service that emphasizes user-friendliness and simple operation. This platform provides a website and server along with application and network detection without requiring technical installation setups.
Users can resolve concerns quickly through Anturis since it provides performance evaluation data alongside live threat notifications along fault diagnosis tools. Anturis allows businesses to choose between agent-based and agentless monitoring through its dual deployment method so organizations can find easy-to-implement monitoring options.
Key Features:
- Server and network monitoring
- Website and web application monitoring
- Customizable alerts and notifications
- Performance graphs and reports
- No installation required; cloud-based solution
Pros:
- Easy to set up with a user-friendly interface
- Suitable for both external and internal monitoring
Cons:
- Limited advanced features compared to competitors
- May not be ideal for very large infrastructures
Who Should Use It? Small to medium-sized businesses looking for a straightforward, cloud-based monitoring solution.
6. AppDynamics
AppDynamics – a subunit of Cisco – allows customers to monitor application performance through solutions that display extensive data about how applications function while assessing user interactions. AppDynamics enables businesses to achieve better performance through real-time analytics therefore enabling them to analyze metrics, find anomalies and enhance application performance. Organizations seeking to sustain high application performance standards should choose AppDynamics because it operates in complex distributed environments.
Key Features:
- End-to-end transaction monitoring
- Dynamic baselining and anomaly detection
- Real-time business performance monitoring
- Code-level diagnostics
- Cloud and on-premises deployment options
Pros:
- Deep insights into application performance
- Real-time monitoring with proactive alerts
Cons:
- Can be complex to implement and configure
- Higher price point compared to some competitors
Who Should Use It? Enterprises with complex, distributed applications seeking detailed performance monitoring and diagnostics.
7. SolarWinds
The platform of SolarWinds offers several IT management and monitoring tools that work to simplify IT operations. Its solutions include network performance monitoring, server and application monitoring, and database performance analysis. SolarWinds enables IT professionals to access useful information, solve problems, and improve the performance of their infrastructure with its intuitive dashboards and interface customization options. Organizations can select from multiple modular components to implement tools that fit their unique needs.
Key Features:
- Network performance monitoring
- Server and application monitoring
- Configuration and log management
- Virtualization monitoring
- Customizable alerts and reports
Pros:
- Comprehensive suite covering various IT monitoring needs
- Scalable solutions suitable for different business sizes
Cons:
- Some tools may require separate licenses
- Interface can be overwhelming for new users
Who Should Use It? IT departments seeking a broad range of monitoring tools within a single ecosystem.
8. Zabbix
Zabbix serves as an open-source platform that delivers enterprise-level monitoring capabilities for evaluating networks and servers as well as cloud services and applications. Zabbix provides live system checks through alerts and a graphical user interface and enables installation for diverse operational modes. Organizations looking for a customizable and scalable monitoring solution free of licensing costs should select Zabbix which offers high-capacity environment support.
Key Features:
- Network discovery and auto-registration
- High-level business service monitoring
- Customizable dashboards and reports
- Distributed monitoring with centralized management
- Advanced problem detection and intelligent alerting
Pros:
- Open-source and free to use
- Highly customizable and scalable
Cons:
- Requires technical expertise for setup and maintenance
- Limited official support; relies on community assistance
Who Should Use It? Organizations with technical expertise seeking a customizable and scalable open-source monitoring solution.
9. Dynatrace
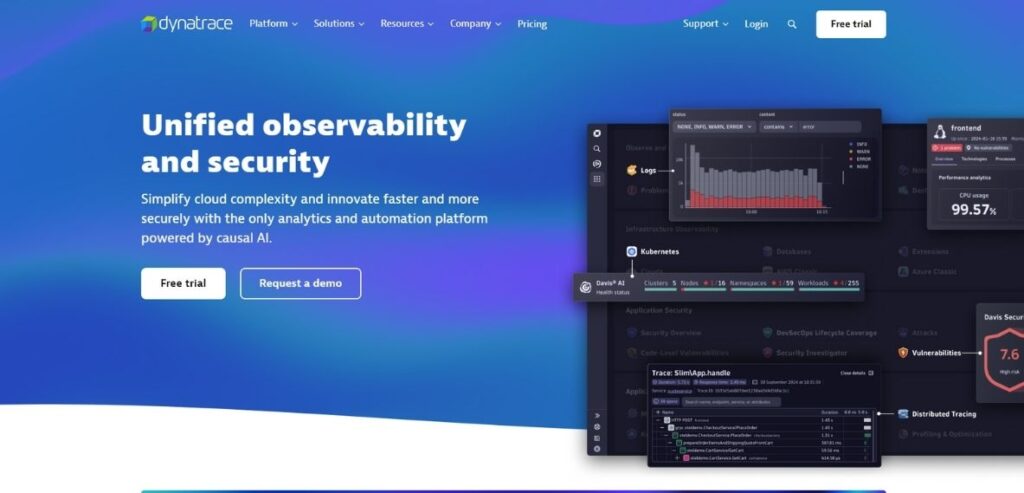
Dynatrace offers customers a software intelligence platform based on artificial intelligence that automates the monitoring of applications together with traces of user experiences and infrastructure elements. The platform functions with AI technologies to identify all application dependencies automatically while detecting anomalies and identifying causes of issues. The application performance and seamless user interaction of organizations improve through Dynatrace because it features both full-stack monitoring and code-level diagnostics.
Key Features:
- Automatic discovery and mapping of applications and infrastructure
- AI-powered root cause analysis
- Real user and synthetic monitoring
- Application performance monitoring
- Cloud infrastructure monitoring
Pros:
- AI-driven insights for proactive issue resolution
- Automatic discovery simplifies setup
Cons:
- Premium pricing may be a barrier for smaller organizations
- Complexity may require a learning curve
Who Should Use It? Enterprises operating in dynamic cloud environments seeking automated
10. LogicMonitor
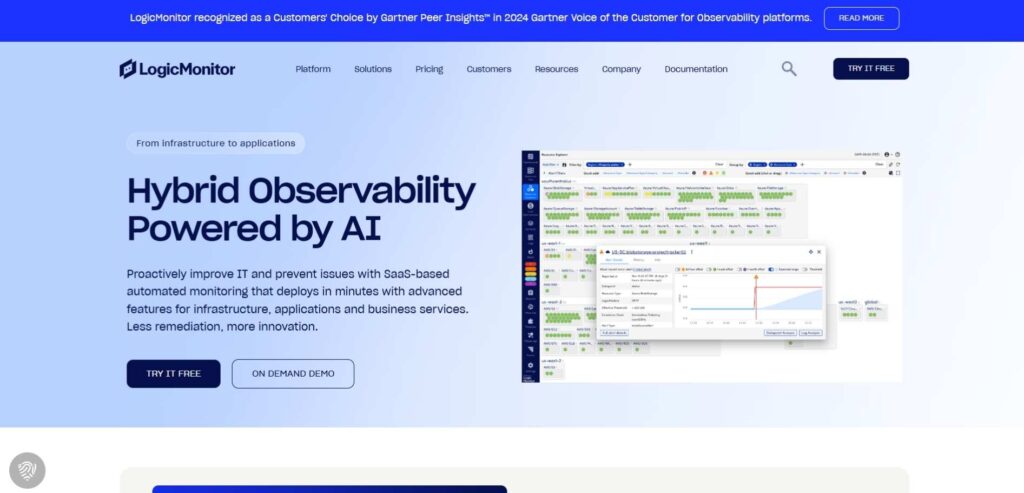
LogicMonitor operates as a cloud-based platform for infrastructure monitoring that reveals complete network server application and cloud service details. LogicMonitor automates infrastructure monitoring by carrying out discovery features as well as configuration tasks and provides customizable dashboards and alert systems. The flexible architecture of LogicMonitor helps organizations with their goal of optimizing performance throughout various infrastructure combinations.
Key Features:
- Automatic discovery and monitoring of devices and applications
- Customizable dashboards and reporting
- Anomaly detection with machine learning capabilities
- Over 2,000 integrations with various technologies
- Scalable architecture suitable for enterprises
Pros:
- User-friendly interface with intuitive setup
- Comprehensive monitoring across diverse environments
Cons:
- Pricing may be higher for smaller organizations
- Some users report a learning curve for advanced features
Who Should Use It? Enterprises seeking a scalable and comprehensive monitoring solution with extensive integration capabilities.
11. Icinga

The open-source monitoring software Icinga performs checks on network resource availability together with performance data generation followed by immediate administrator notifications about system issues. The system contains a modular design that enables users to build custom solutions and extend their operations.
The system provides instantaneous service check-ups and report generation while operating with a wide range of plugins to accommodate various monitoring requirements. Icinga stands out because it features open-source capabilities along with flexibility that fits organizations needing personalized monitoring requirements.
Key Features:
- Modular architecture with customizable plugins
- Scalable monitoring for large environments
- Advanced notification and escalation capabilities
- Web-based interface with detailed reporting
- RESTful API for integrations
Pros:
- Highly customizable and flexible
- Strong community support
Cons:
- Requires technical expertise for setup and configuration
- Limited official support options
Who Should Use It? Organizations with technical expertise seeking a flexible and customizable open-source monitoring solution.
12. Sensu
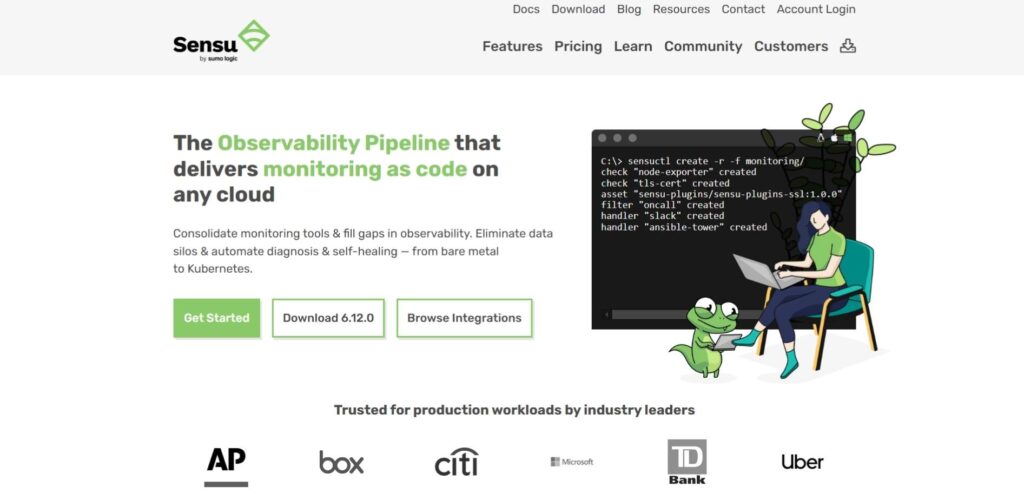
The monitoring solution Sensu operates specifically for sites using dynamic cloud-native infrastructure. Organizations gain visibility of their infrastructure and applications along with services through a system based on flexible architecture. Sensu provides three features: health checks, event processing and automated remediation which help prevent system health problems proactively. Sensu enables organizations to customize their monitoring capabilities through its capability to support user-developed plugins and integrations.
Key Features:
- Event-driven architecture for real-time monitoring
- Support for both agent-based and agentless monitoring
- Built-in support for metrics collection and processing
- Integration with various data visualization and alerting tools
- Scalable design suitable for cloud-native environments
Pros:
- Adaptable to various monitoring needs
- Strong support for modern infrastructure and workflows
Cons:
- May require significant configuration for complex setups
- Limited out-of-the-box dashboards and visualizations
Who Should Use It? Organizations adopting cloud-native technologies seeking a flexible and scalable monitoring solution.
13. ManageEngine OpManager
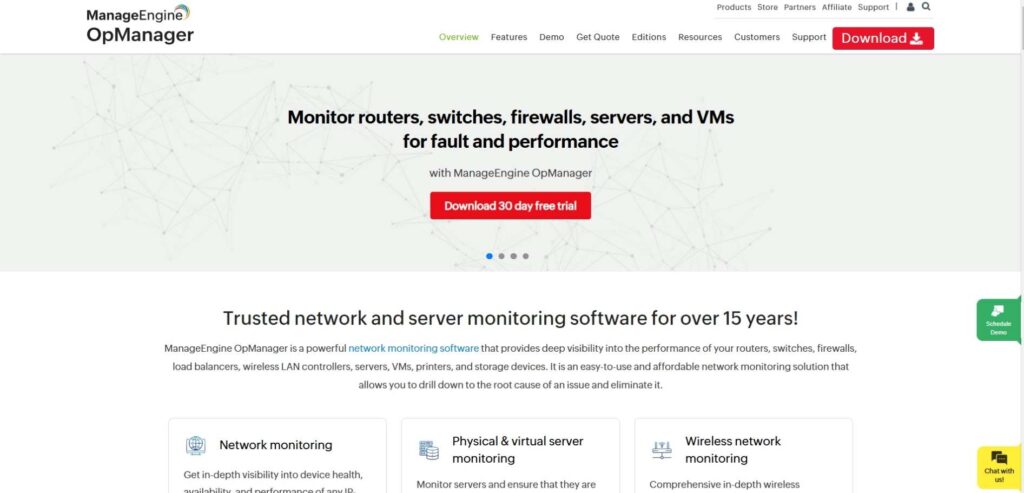
The network management software ManageEngine OpManager enables real-time monitoring of all network devices servers and applications. IT teams can ensure network reliability and performance through the platform which includes bandwidth analysis fault management and performance monitoring features. The network operations become easier to manage through OpManager dashboards which also automate workflows to speed up trouble detection.
Key Features:
- Real-time network monitoring with customizable dashboards
- Advanced fault and performance management
- Comprehensive reporting and analytics
- Support for a wide range of devices and vendors
- Automated workflows for routine network tasks
Pros:
- User-friendly interface with easy setup
- Affordable pricing with a rich feature set
Cons:
- Some advanced features may require additional modules
- May not scale as efficiently in very large environments
Who Should Use It? Small to medium-sized businesses seeking an affordable and comprehensive network monitoring solution.
14. Opsview
As a professional IT monitoring tool, Opsview delivers full network application and cloud environment visibility. The platform employs automated discovery in addition to predictive analytics in giving real-time monitoring solutions through customizable dashboards. Being a modularly designed piece of software allows businesses to connect it with prominent DevOps tools which is why it is ideal for centralizing their monitoring system.
Key Features:
- Unified monitoring for diverse environments
- Advanced alerting and notification system
- Customizable dashboards and reporting
- Scalable architecture suitable for large enterprises
- Integration with various IT operations tools
Pros:
- Comprehensive coverage of various infrastructure components
- Scalable design for growing organizations
Cons:
- Pricing may be higher compared to some competitors
- Initial setup can be complex
Who Should Use It? Large enterprises with complex IT environments seeking a unified monitoring solution.
eking a comprehensive, cloud-based monitoring solution to ensure the performance and reliability of their websites, applications, servers, and networks.
Comparison of Server Monitoring Tools
Here’s a comparison table of the specified server monitoring tools, highlighting their key features, pricing, use cases, and official websites:
| Tool | Key Features | Pricing | Use Cases | Website |
| Dotcom-Monitor | Global monitoring network, real-time error analysis, advanced alert notifications, integration with various communication channels, private network monitoring | Starting at $19.99/month | Enterprises seeking comprehensive monitoring with global reach and advanced alerting. | dotcom-monitor.com |
| Site24x7 | Unified console for infrastructure monitoring, Custom monitoring via plugins, Anomaly detection, Superior reporting, Real user and synthetic monitoring | Starting at ₹2,800/mo(paid annually) | Organizations looking for a unified monitoring solution with extensive customization and reporting. | site24x7.com |
| NinjaOne | Unified endpoint management, Proactive management with live data, Network-agnostic monitoring, Configurable alerts, Stellar service and support | Upon request | IT professionals seeking comprehensive endpoint management with proactive monitoring and excellent support. | ninjaone.com |
| Datadog | Real-time monitoring of servers, databases, tools, and services, Advanced analytics, Customizable dashboards, Integration with various platforms, Scalable infrastructure | Starting At$15Per host,per month | Organizations needing real-time monitoring and analytics across dynamic, high-scale infrastructures. | datadoghq.com |
| Anturis | Cloud-based monitoring, Server and network monitoring, Application monitoring, Customizable alerts, Visual performance dashboards | Offers a free plan with basic features; premium plans are available with additional features. | Small to medium-sized businesses seeking a cloud-based monitoring solution with essential features. | anturis.com |
| AppDynamics | Application performance monitoring, End-user monitoring, Infrastructure visibility, Business performance monitoring, Advanced analytics | Pricing details are available upon request; typically tailored to enterprise needs. | Large enterprises requiring in-depth application performance insights and business analytics. | appdynamics.com |
| SolarWinds | Comprehensive server and application monitoring, Customizable alerts, Performance analysis dashboards, Capacity planning, Integration with various IT tools | Offers a range of products with varying pricing; detailed information is available on their official website. | Organizations seeking a broad suite of IT management and monitoring tools. | solarwinds.com |
| Zabbix | Open-source monitoring solution, Network monitoring, Server monitoring, Application monitoring, Customizable dashboards and alerts | Free and open-source; no licensing fees. | Organizations looking for a free, open-source monitoring solution with a strong community support. | zabbix.com |
| Dynatrace | Full-stack monitoring, AI-powered analytics, Automatic discovery and mapping, Real user monitoring, Cloud infrastructure monitoring | Starting at $0.001per synthetic request | Enterprises seeking automated, AI-driven monitoring across complex, dynamic environments. | dynatrace.com |
| LogicMonitor | Cloud-based infrastructure monitoring, Application performance monitoring, Customizable dashboards, Automated alerts and notifications, Integration with various platforms | List price$2.50USDPer GB/month for 7-day retention | Organizations needing a scalable, cloud-based monitoring solution with extensive integration capabilities. | logicmonitor.com |
| Icinga | Open-source monitoring, Network monitoring, Server monitoring, Application monitoring, Customizable alerts and dashboards | Free and open-source; enterprise support is available at an additional cost. | Organizations seeking a flexible, open-source monitoring solution with customization options. | icinga.com |
| Sensu | Open-source monitoring, Infrastructure and application monitoring, Customizable alerts, Integration with various platforms, Scalable architecture | Starting at $3, per-node, per-month(paid annually) | Organizations looking for a scalable monitoring solution with both open-source and commercial support options. | sensu.io |
| ManageEngine OpManager | Network and server monitoring, Application performance monitoring, Customizable dashboards, Automated workflows, Real-time alerts | Upon request. | IT teams seeking an integrated monitoring solution for networks, servers, and applications. | manageengine.com/opmanager |
| Opsview | Unified IT monitoring, Scalability for large environments, Customizable dashboards, Automated alerts, Integration with various platforms | Starting at $6 per host per month | Large organizations requiring a scalable monitoring solution with unified visibility across IT assets. | opsview.com |
Conclusion
The best server monitoring tool is always a choice made according to an organization’s needs. Large enterprises that require high-level analytics, automation, and AI-driven insights will prefer the top three, which are Dynatrace, Datadog, and AppDynamics. These tools come with deep observability and cloud-native monitoring. Businesses focused on network monitoring, with strong infrastructure management capabilities, will find SolarWinds and ManageEngine OpManager to be the best.
For small businesses and startups, Zabbix and Icinga offer open-source, cost-effective solutions with extensive customization options. NinjaOne and Site24x7 fit well with IT teams that need a user-friendly, cloud-based monitoring platform with automated issue detection. LogicMonitor and Opsview have hybrid capabilities that are ideal for businesses managing both on-premises and cloud infrastructure.
Sensu and Anturis are cloud-native solutions that provide greater flexibility and deep integration capabilities, are better suited to large containerized and microservices environments, and are suitable for developers and DevOps teams. Again, it depends on the business size, budget, and the complexity of the infrastructure.
FAQs
1. What is a server monitoring tool, and why is it important?
A server monitoring tool is software that constantly monitors the health, performance, and availability of a server. It gives insight into CPU usage, memory consumption, disk space, network activity, and application performance. It is an important tool to avoid downtime, optimize resources, and ensure a seamless user experience.
2. What functionalities should a server monitoring tool possess?
Product/Service Key Features:
- Real-time performance monitoring
- Automated alerts and notifications
- Historical data analysis and reporting
- Integrations with third-party applications
- Scalable to monitor numerous servers
- Customizable dashboards and visualization tools
3. Do free server monitoring tools exist?
Yes, for instance, several free and open-source tools, like Zabbix, Icinga, and Sensu, are available. These can be monitored well but are free; hence, nobody pays for their licensing, and they may also be complex for technical persons to install and manage. Paid ones will usually feature, support and be easy to use.
4. How does server monitoring aid security?
Detection of anomalies such as login attempts from unknown users, strange spikes in traffic, or a decrease in performance that may be indicative of an attack. Most of them integrate with security solutions to monitor a variety of threats in real time.
5. What is the main difference between cloud-based and on-premises server monitoring tools?
Cloud-based monitoring tools include: e.g., Datadog, LogicMonitor, Site24x7, etc. They require little or no infrastructure to set up. Ideal for remote monitoring and scalability. On-premises monitoring tools, such as Nagios, Zabbix, ManageEngine OpManager, etc., are installed on an organization’s network and therefore allow control over data, more so concerning security.